Frequently asked questions about curve tracing
What is solar PV I-V curve tracing?
What is STC and why is it significant?
Where should the PV module temperature sensor be positioned?
Can I use an infrared thermometer to measure the PV module temperature?
How is solar irradiance measured?
Where should the solar irradiance meter be positioned?
Can I perform I-V curve measurements at low irradiance levels?
What happens if the irradiance changes during an I-V curve measurement?
What are the benefits of I-V curve tracing?
Why is I-V curve tracing important?
Is I-V curve tracing only useful during installation?
How does temperature and irradiance affect I-V curves?
What are the typical problems that can be identified by I-V curve tracing?
How do I-V curve tracers work?
How does I-V curve tracing rank alongside other solar PV commissioning and periodic tests?
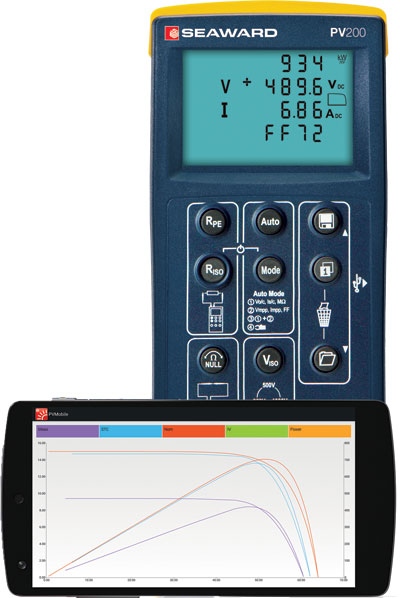
The PV200 PV tester with curve tracing
The PV200 provides a highly efficient and effective test and diagnostic solution for PV systems, carrying out all commissioning tests required by IEC 62446:2016 and performing fast and accurate measurement of I-V curves in accordance with IEC 61829:2015.
When used in conjunction with the Solar Survey 200R irradiance meter, the PV200 measurement data can be converted to STC, using either the PVMobile app or SolarCert software, allowing direct comparison with the PV module manufacturer’s published data
What is solar PV I-V curve tracing?
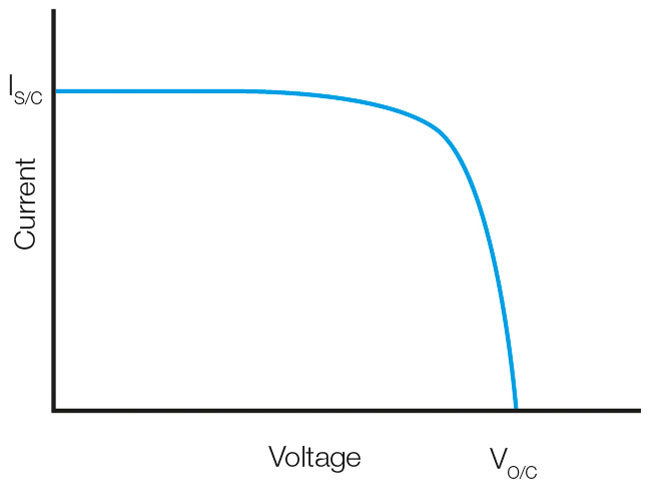
The electrical power produced by a solar PV cell or module is a function of the current (I) and voltage (V) characteristics. Measuring the relationship between current and voltage whilst varying the electrical load connected to the PV cell or module from open circuit to short circuit produces a characteristic current vs voltage (I-V) curve as shown below in figure 1. The points where the curve meets the current and voltage axis are the short circuit current Is/c and open circuit voltage Vo/c respectively.
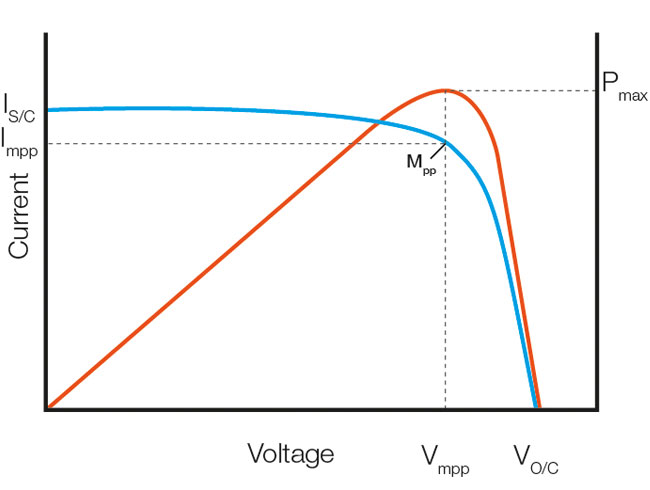
Power is the product of voltage and current and so the power vs voltage curve shown in figure 2 can be generated from the measured voltage and current data. The power vs voltage curve shows the point at which the power is a maximum (Pmax). The corresponding maximum power point Mpp is shown on the I-V curve. Loading the PV module such that the current is Impp and voltage is Vmpp will operate the PV module at the maximum power point (Mpp) and result in the maximum power generation.
What is STC and why is it significant?
All PV modules have information shown on the rating plate which relates to the module performance, including values for open circuit voltage (Vo/c), short circuit current (Is/c), voltage and current at the maximum power point (Vmpp and Impp) and the maximum power (Pmax). When PV modules are produced, manufacturers check the performance and determine the rating plate values by carrying out an I-V curve measurement.
The voltage and current produced by a PV module depend upon the irradiance level, the spectral content of the irradiance and module temperature. If the data on a PV module rating plate is to be meaningful, we need to know the conditions when the measurements were made. Manufacturers measure the rating plate values under standard test conditions (STC) with an irradiance of 1000W/m2, a module temperature of 25oC and using an irradiance source equivalent to an air mass AM=1.5.
If we want to compare performance data measured in the field directly with the rating plate values, the measurements must be converted to STC. The conversion requires measured values for the irradiance level and PV module temperature at the time of measurement.
Where should the PV module temperature sensor be positioned?
IEC 61829:2015 Photovoltaic (PV) array - On-site measurement of current-voltage characteristics recommends that a flat thermal sensor with fine leads is mechanically attached directly to the backsheet in the middle of a module. The thermal sensor should be at least 10 cm from any junction box but opposite an active part of the module. The attachment method should not change the temperature of the PV module.
Can I use an infrared thermometer to measure the PV module temperature?
The accuracy of any infrared temperature measuring device is influenced by the emissivity (ability to emit infrared energy) of the surface being measured. An infrared thermometer should only be used if it has been calibrated for the PV module backsheet emissivity such that the temperature measurement accuracy meets the ± 1 °C required by IEC 61829:2015
How is solar irradiance measured?
Solar irradiance metering equipment used during the assessment of PV modules must have a spectral response that matches that of the PV module or system under test.
There are two irradiance measurement methods defined and accepted by international standards covering the performance measurement of PV systems:
Pyranometer
An instrument for measuring the intensity of solar irradiance, normally used to measure global irradiance on a horizontal plane. Pyranometers are generally high precision, high cost instruments using thermal sensors in a glass dome.
PV Reference Cell
A small PV cell with a known current vs irradiance characteristic, constructed using the same cell technology as the PV system under test. If they are not constructed using the same cell technology, an estimate of any uncertainty can be made. Spectral mismatch is of particular concern with thin film modules. Reference cells commonly have temperature compensation to ensure that the measurement accuracy is not affected changes in temperature.
Instruments such as light meters, lux meters or devices using photo diode sensors may appear to offer a low cost solution for measuring irradiance however they do not have the same spectral response as a PV module; they do not compensate for temperature and are likely to introduce significant measurement errors if used for solar PV applications. They are not suitable for PV system performance testing and assessment.
Where should the solar irradiance meter be positioned?
It is important that the solar irradiance meter is correctly positioned in relation to the PV system under test to ensure that meaningful data is collected. Varying the angle between the reference cell and the sun can cause significant changes in measured irradiance. The irradiance meter must be positioned so that it is in the same plane as the PV module within ± 2°. The irradiance meter must be positioned so that it does not shade any part of the PV system under test. Accurate and repeatable measurements are best achieved by mechanically securing the irradiance meter to the PV module framework.
Can I perform I-V curve measurements at low irradiance levels?
The shape of the I-V curve varies with irradiance and below a critical level of irradiance the curve shape changes dramatically. This can result in errors in evaluating the performance of the system. Poor results may be expected where measurements are taken in low irradiance.
PV string and array performance measurements should be performed at stable irradiance conditions of at least 400 W/m2 as measured in the plane of the array. For measurements to be converted to STC, IEC 61829:2015 Photovoltaic (PV) array —On-site measurement of current-voltage characteristics recommends that the total in-plane irradiance shall be at least 700 W/m2.
What happens if the irradiance changes during an I-V curve measurement?
Ideally, I-V curve measurements should be made when there is a clear sky and little wind. Changes in irradiance will produce variations in PV module temperature that can affect the accuracy of I-V curve measurements. If the irradiance has increased significantly immediately before measurements are made, the PV module temperature may not have stabilised. Changes in irradiance during an I-V curve measurement can influence the shape of the I-V curve.
However, the reality is that time and contractual constraints limit the periods in which it is possible to perform a test. I-V curve measurements should be made under the most possible stable conditions and variations in irradiance and module temperature should be recorded. If the changes in irradiance alter the shape of the I-V curve the measurement should be repeated.
What are the benefits of I-V curve tracing?
Power is a function of current and voltage and so anything that reduces the current or voltage generated by a PV system will reduce the power that is produced. The shape or profile of the I-V curve therefore provides a highly effective visual indication of the performance of a PV module or string.
Real-time power monitoring systems provide an indication of the actual power generated however, if the actual yield is less that the design figure, they provide no information other measurement tools are required to identify the root cause of an under-performing PV system.
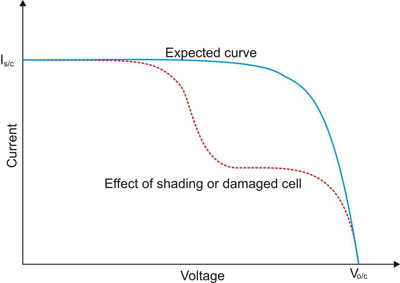
If when tested, the I-V curve for the installed string shows a distinct change in the angle of slope, has 'humps' or shifts in the shape of the curve, then these will indicate that something is wrong with one or more of the individual modules.
An assessment of the I-V curve during the installation or commissioning or as part of a period inspection and test of a system can therefore help to verify that all the modules are healthy and performing at a consistent level in line with their specified parameters.
Why is I-V curve tracing important?
The I-V curve provides a quick and effective means of accessing the true performance of solar PV modules or strings. In a correctly performing PV system the shape of the curve should follow the normal profile and the measured values of Is/c, Impp, Vo/c, Vmpp and Pmax should be as expected for the environmental conditions at the time of measurement.
As part of the manufacturing process, modules are tested under standard conditions (STC) at an irradiance of 1000W/m2, a temperature of 25oC and air mass of 1.5. Measurements of irradiance and temperature captured at the same time as the I-V curve data can be used to convert field I-V curve measurements to STC. Corrected measurements can then be used for a direct comparison with the rating plate figures.
At the factory stage, the testing is used to identify any manufacturing problems and also to verify the power rating of a particular module for inclusion in product datasheets and specifications.
Once a module or string has been installed on site, I-V curve tracing can be carried out to create an operational I-V curve to confirm that the actual power output is close to the predicted value of the new system.
If there is a discrepancy, analysis of the I-V curve shape can be used to help identify the root cause for the under-performance and remedial measures can be implemented.
Is I-V curve tracing only useful during installation?
No, over time, periodic I-V curve tracing is a highly effective tool to check for deterioration in performance of the system. It can be used to identify and locate module or wiring issues and compare power generation performance against previous performance data or product warranty data. I-V curve measurements can also highlight the effect of partial or uniform shading and demonstrate the improvement in performance after module cleaning.
What is the PV Fill Factor?
Fill factor (FF) is the ratio of the actual maximum obtainable power, represented by the dark blue box, to the product of short circuit current Is/c and open circuit voltage Vo/c, represented by the light blue box.
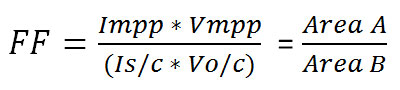
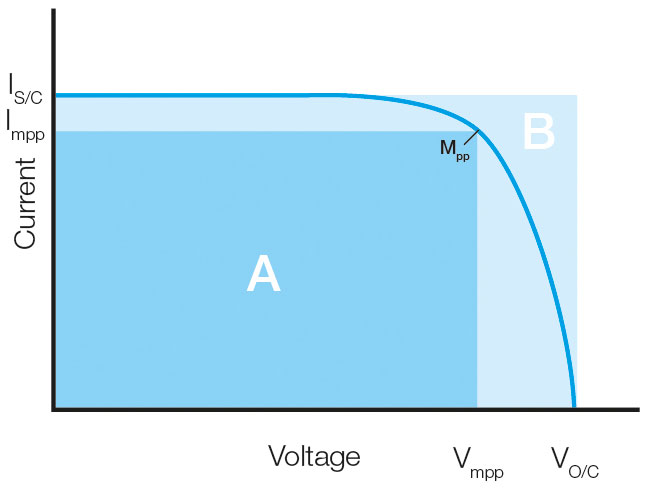
The Fill Factor is essentially a measure of the efficiency of a PV module, the theoretical maximum value depending on factors such as the type of silicon used to construct the module. However, deviation from the expected value or changes in Fill Factor can provide an indication that a fault is present.
How does temperature and irradiance affect I-V curves?
There are various factors that can influence the performance of solar PV modules, including temperature and irradiance.
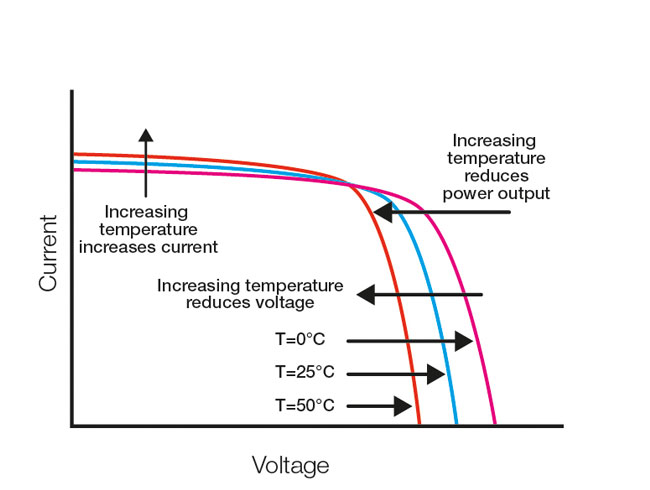
The open circuit voltage of a PV module varies with cell temperature. As the temperature increases, due to environmental changes or heat generated by internal power dissipation during energy production, the open circuit voltage (Voc) decreases. This in turn reduces the power output. The design of a solar PV system must take into account the PV module temperature coefficient, comparing the expected average cell temperature in its operational environment, against the STC data used to calculate the module output.
In the same way, irradiance will also affect module performance, with a reduction of sunlight resulting primarily in a reduction in current and consequentially a reduced power output.
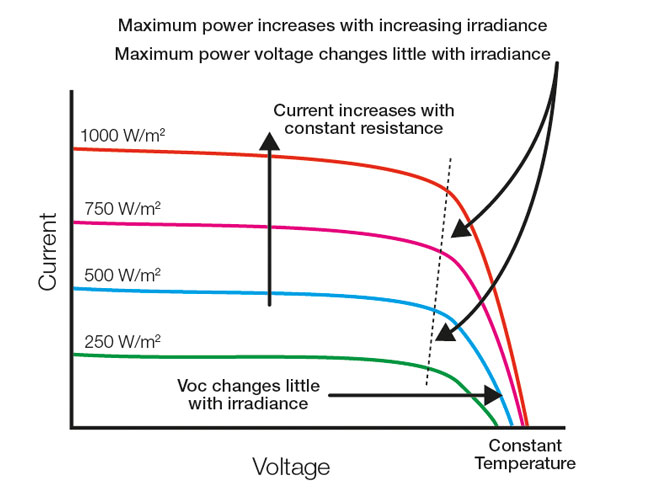
When comparing I-V curves measured in the field with predicted profiles, full consideration of these factors needs to be taken into account if the comparison is to produce meaningful results.
What are the typical problems that can be identified by I-V curve tracing?
Differences in the curve shape and the Fill Factors associated with a particular module or sting can indicate a problem in the quality, power performance or correct installation of the solar PV system.
Typical problems encountered with an installation that will have an effect on the expected I-V curve could include soiling, shading of the modules, high resistance wiring or connection problems between modules, a mismatch of modules caused by manufacturing or specification differences or the PV cells are damaged.
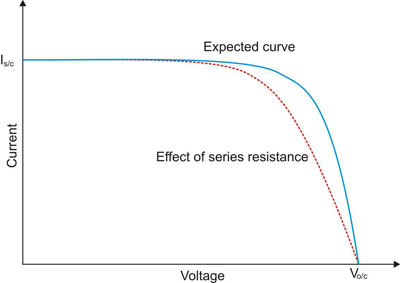
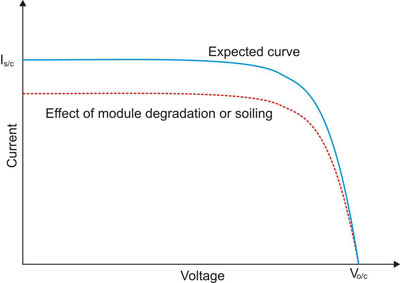
The I-V curve tracer can be used to as a diagnostic tool to identify, locate and rectify any of these problems.
How do I-V curve tracers work?
I-V curve tracers are specialist types of test equipment that sweep an electrical load connected to the solar PV module or string and measure both the current and voltage at multiple points during the sweep. The pairs of current and voltage values are then used to plot an I-V curve directly or to calculate and plot a P-V curve.
To overcome the influence of external factors such as temperature and irradiation, I-V curve tracers typically measure and record irradiance and temperature to allow measurements to be converted to STC to enable an accurate comparison to be made with the PV module specification.
Some I-V tracers also incorporate databases of PV module data to enable measured values in the field to be immediately compared with the values declared by the manufacturer as a means of verifying the fitness for purpose and performance of installed systems.
How does I-V curve tracing rank alongside other solar PV commissioning and periodic tests?
The installation of solar PV systems involves not only performance and efficiency tests at the time of installation, but also checks to ensure that the system has been wired correctly and safely. These should be repeated periodically to determine ongoing safety and performance.
'IEC 62446:2016 Grid connected PV systems' defines the minimum requirements for solar PV system documentation, commissioning tests and inspection. Although it is not mandatory, various countries have already adopted the principles of IEC 62446:2016 in their national accreditation schemes, including the MCS in the UK.
In summary, the standard sets out the testing, information and documentation that should be provided to the customer following the installation of a solar module system and also the initial (and periodic) electrical inspection and testing required.
The absolute minimum testing that needs to be undertaken during commissioning involves continuity measurements, open circuit voltage, short circuit current, insulation and irradiance. I-V curve tracing can also be added to this list to assess the performance characteristics of the installed system.


Sign up to our Newsletter.
Stay up to date with the latest industry and product news, as well as our free educational content such as webinars and our expert guides.
Close